Key Tools for Forecasting in Forex: A Deep Dive into Chart Patterns
Estimated reading time: 8 minutes
Key Takeaways
- Chart patterns serve as crucial tools in forex technical analysis, aiding traders in visualizing potential price movements.
- Understanding these patterns can provide traders with actionable signals for informed decision-making.
- Among the types of chart patterns, reversal, continuation, and bilateral patterns are especially notable.
- The utility of chart patterns is amplified when used alongside other technical analysis tools.
Table of contents
- Understanding Forex Chart Patterns: A Broad Perspective
- Unmasking the Role of Forex Technical Analysis Chart Patterns
- Demystifying Common Forex Chart Patterns
- Understanding Candlestick Patterns in Forex
- The Roadmap to Identify Chart Patterns in Forex
- Mastering the Art of Making Trading Decisions With Chart Patterns
- The Upsides of Chart Patterns in Forex Technical Analysis
- Recognizing the Limitations of Forex Technical Analysis Chart Patterns
- Expert Chart Pattern Strategies in Forex
- Navigating the Common Chart Pattern Trading Pitfalls
- Wrapping Up
Understanding Forex Chart Patterns: A Broad Perspective
In the arena of forex, chart patterns essentially exist as formations produced by price changes of currency pairs over time. These patterns provide traders with visual cues, setting a pathway into the future direction of financial market trends. Armed with these patterns, traders are able to forecast whether a trend would persist or invert. This understanding paves the way for profitable trades.
Chart patterns shine a light on the collective behavior of traders and reflect the psychological mechanisms of market participants. These patterns act as reputable indicators of fluctuations in supply and demand, contributing to potential price shifts.
Unmasking the Role of Forex Technical Analysis Chart Patterns
Chart patterns offer traders a visual guide to the psychology of the market. Traders equipped with these patterns have the ability to understand the market sentiment, which enables informed trading decisions. In contrast to other technical analysis tools like moving averages or oscillators— which lean heavily on intricate computations of past price actions— these patterns offer simple, actionable signals. They deliver visual clarity that facilitates faster, more intuitive decision-making.
Demystifying Common Forex Chart Patterns
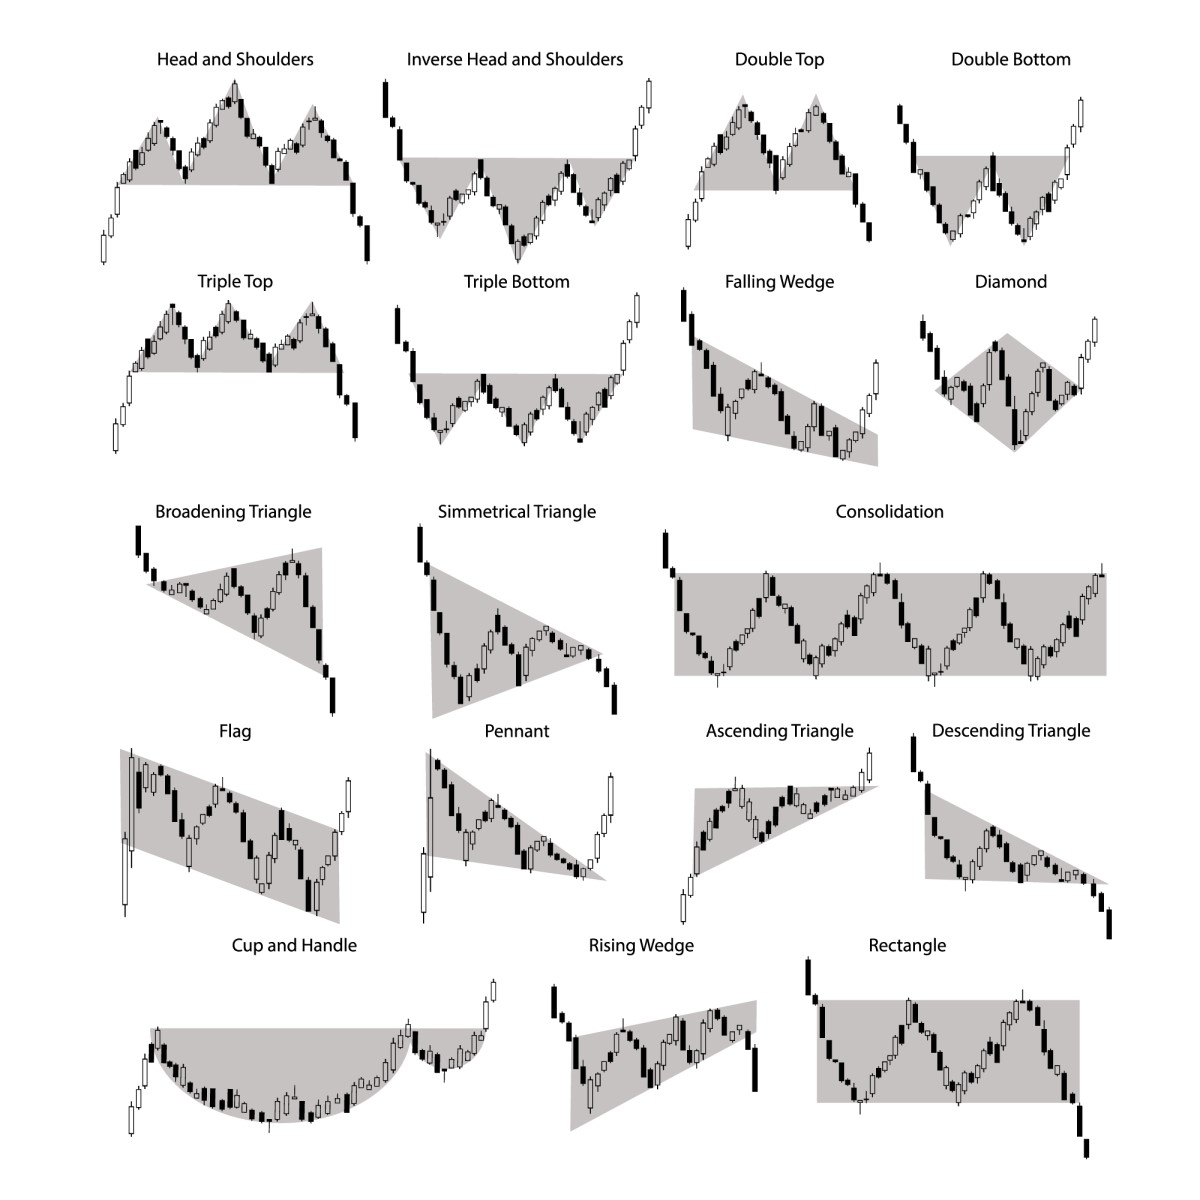
Forex chart patterns are predominantly characterized into three categories: reversal, continuation, and bilateral patterns. Having a grasp on these patterns steers traders to recognize possible alterations in market direction.
Decoding the Head and Shoulders Pattern in Forex
The head and shoulders pattern, famously referred to as H&S, is a recognized reversal pattern. It hints at a possible transition from a bullish to a bearish trend. This pattern is sculpted from three peaks: the left shoulder, the head, and the right shoulder. The ‘neckline’— a support level— connects the troughs following each peak. A breakthrough below the neckline hints at a possible downward turn.
The Double Top and Double Bottom Patterns Unboxed
Double top and double bottom patterns are reversal patterns that often suggest trend exhaustion. The double top pattern consists of two consecutive peaks at a similar level, hinting at a possible reversal from an upward trend to a downward trend. It’s confirmed when the price penetrates the support level or neckline.
Conversely, a double bottom pattern encompasses two successive troughs at a comparable level, suggesting a bullish turn. Following a downtrend, this pattern is confirmed when the price ascends over the resistance level.
An Insight into Triangle Patterns
Triangle patterns are seen as signals of market consolidation prior to substantial price movements. The three main subdivisions of triangle patterns are the ascending, descending, and symmetrical triangles.
Understanding Candlestick Patterns in Forex
Alongside regular chart patterns, understanding candlestick patterns is an important aspect of forex technical analysis. Each candlestick on a chart provides frequency-relevant market sentiment details including the market’s open, high, low, and close prices. Merging candlestick patterns with traditional chart patterns enhances the precision of technical analysis.
The Roadmap to Identify Chart Patterns in Forex
The key to identifying chart patterns in forex involves a systematic approach:
- **Cleaning Up the Charts:** By removing non-essential indicators, clarity of price action is improved.
- **Identifying Significant Highs and Lows:** Seek out peaks and troughs that could potentially form patterns.
- **Recognition of Patterns:** Observe shapes representing known chart patterns.
- **Use of Drawing Tools:** Demarcate patterns using trendlines and identify support and resistance levels.
- **Confirmation Using Indicators:** Patterns are validated using volume indicators or other candlestick confirmations.
Mastering the Art of Making Trading Decisions With Chart Patterns
Chart patterns provide guidance to traders making trading decisions. For instance, they can be made instrumental to identify entry and exit points in the market. Market entry is often made post a pattern confirmation (for instance, post a breakout), and an exit or take-profit order may be set according to the size of the pattern or the next support or resistance levels. Importantly, setting stop-loss orders beyond key pattern levels limit potential losses if the price unexpectedly reverses.
The Upsides of Chart Patterns in Forex Technical Analysis
Chart patterns premier many advantages:
- **Simplicity:** They are easy to identify and implement without requiring complicated calculations.
- **Reliability:** Being validated over decades, they are known to offer consistent results.
- **Visual Clarity:** They offer clear signals for market entries and exits, hence aiding in decision-making.
- **Versatility:** Chart patterns are applicable across different time frames and currency pairs and can be merged with other technical tools for better precision.
Recognizing the Limitations of Forex Technical Analysis Chart Patterns
While chart patterns are of great value, they also come with limitations:
- **Subjectivity:** As pattern recognition can be swayed by individual biases, charts could be interpreted differently by different traders.
- **False Breakouts:** Not all patterns result in a sustained price movement, leading to false breakouts and in turn losses.
- **Need for Confirmation:** Chart patterns deliver superior performance when supported with other analysis methods.
Expert Chart Pattern Strategies in Forex
Experienced traders often employ more complex strategies, such as identifying patterns within patterns to enhance signals, integrating candlestick confirmation, or utilizing pattern overlays for improved likelihood. For instance, a head and shoulders pattern confirmed by a bearish engulfing candlestick pattern amplifies a strong bearish sign.
Navigating the Common Chart Pattern Trading Pitfalls
Traders should avoid the following missteps:
- **Entering Before Confirmation:** Exercise patience and avoid rushing into trades without complete pattern validation.
- **Ignoring Risk Management:** Overleveraging can result in significant losses, so risk management should never be underestimated.
- **Overreliance on Patterns:** Sole reliance on chart patterns without considering other market factors can lead to inaccurate trading decisions.
- **Neglecting Market Context:** Always consider existing market sentiment and economic events.
Wrapping Up
In the world of forex technical analysis, chart patterns hold an irreplaceable value. They empower traders to decipher market psychology, forecast price shifts, and make well-calculated trading decisions. By mastering these patterns, traders significantly enhance their trading performance. As with any craft, chart patterns mastery hinges on practice and ongoing education. By consistent application of these patterns and adherence to risk management principles, traders can achieve enduring success in the dynamic arena of forex trading.